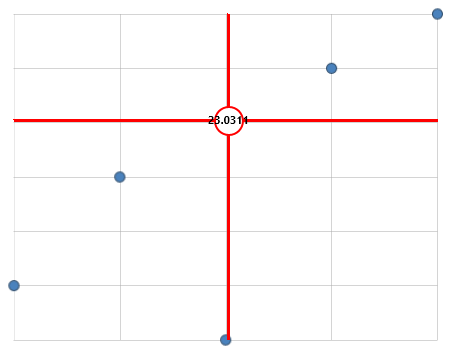
For some charts, you might want a free-floating marker with a crosshair design to emphasize a data point. In this topic, you'll build on the line and dot marker by adding a horizontal marker as well. The completed chart with marker will resemble the following image:

This type of marker uses both XAML markup and some code. Since you're setting a data point to NaN, you'll need to set that in code. WinRT doesn't allow you to set a data point's value to NaN in markup.
| XAML |
Copy Code
|
|---|---|
<c1:C1Chart x:Name="c1Chart3" ChartType="XYPlot" Palette="Office" Margin="20" Height="350" Width="450"> <c1:C1Chart.Data> <c1:ChartData> <c1:ChartData.Children> <c1:DataSeries Label="s1" Opacity="1" Values="20 22 19 24 25"/> </c1:ChartData.Children> </c1:ChartData> </c1:C1Chart.Data> <c1:C1Chart.View> <c1:ChartView> <!-- Markers layer --> <c1:ChartView.Layers> <c1:ChartPanel> <!-- crosshairs --> <c1:ChartPanelObject x:Name="vline" Attach="None" Action="MouseMove" VerticalContentAlignment="Stretch" HorizontalAlignment="Center"> <Border Background="Red" BorderBrush="Red" Padding="1" BorderThickness="1 0 0 0" /> </c1:ChartPanelObject> <c1:ChartPanelObject x:Name="hline" Attach="None" Action="MouseMove" HorizontalContentAlignment="Stretch" VerticalAlignment="Center"> <Border Background="Red" BorderBrush="Red" Padding="1" BorderThickness="0 1 0 0" /> </c1:ChartPanelObject> <c1:ChartPanelObject x:Name="cross" Attach="None" Action="MouseMove" DataPoint="0.5,0.5" HorizontalAlignment="Center" VerticalAlignment="Center"> <Grid DataContext="{Binding ElementName=cross}"> <Ellipse Fill="White" Stroke="Red" StrokeThickness="2" Width="30" Height="30" /> <TextBlock Text="{Binding DataPoint.Y}" FontWeight="Bold" Foreground="Black" VerticalAlignment="Center" HorizontalAlignment="Center"/> </Grid> </c1:ChartPanelObject> </c1:ChartPanel> </c1:ChartView.Layers> </c1:ChartView> </c1:C1Chart.View> </c1:C1Chart> |
|
And here's the code that you'll need:
| C# |
Copy Code
|
|---|---|
((ChartPanel)c1Chart3.View.Layers[0]).Children[0].DataPoint = new Point(-1, double.NaN); ((ChartPanel)c1Chart3.View.Layers[0]).Children[1].DataPoint = new Point(double.NaN, -1); |
|